- What’s the Difference Between a Job Description, Job Posting, and Job Ad - June 5, 2025
- Top 20+ Diversity Equity Inclusion Titles (with Descriptions) 2024 - October 18, 2024
- A List of Common Offensive (Exclusionary) Words Used in Job Descriptions (2024) - October 18, 2024
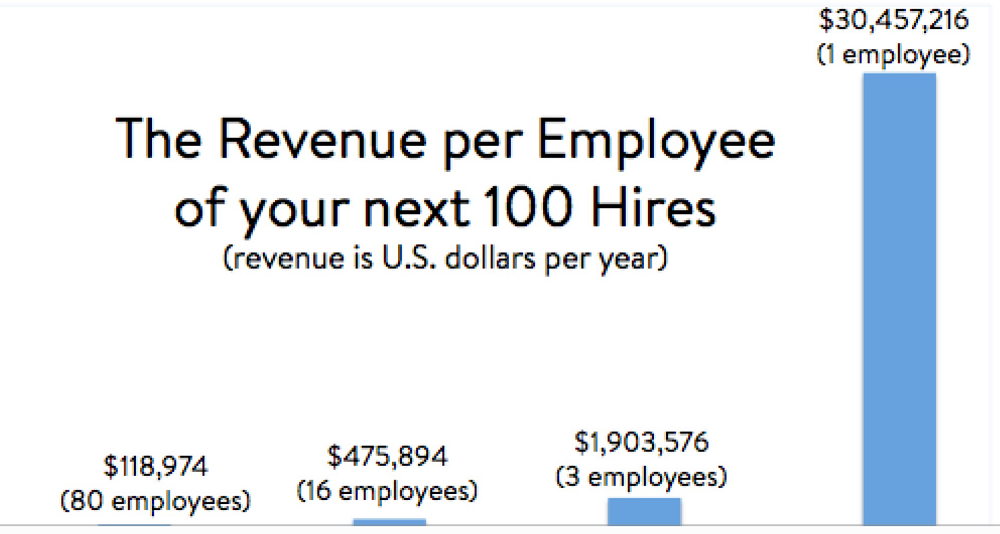
The top star of your next 100 hires should generate about $30,457,216 in revenue per year.
Believe me? That’s the math for the top hire at an average S&P 500 company (and makes Facebook’s hacquisition value of $500K to $1 million per engineer look downright cheap!).
Let me explain the math behind the $30 million claim:
First off, we need a benchline metric to value an employee. Let’s use revenue per employee per year. It’s a simple calculation:
total revenue in a year ÷ average # of employees during the year.
Let’s use the S&P 500 because they have an elite group of publicly traded companies including Apple, Caterpillar, Facebook, Starbucks, Wells Fargo — I think you’d like to shoot for being as productive as those companies, right?
The average S&P 500 company generated $475,894 in annual revenue per employee as of Q1 2015, according to CSI Market Company.
Note: If you’re curious about revenue per employee by industry, I’ve included a list at the bottom of this post.
Superstar Revenue Per Employee
Ok, so if we go with $475K as what the average employee generates per year, then how do we get to what a superstar employee (aka A-Player, Unicorn, etc.) generates?
Because surely not all employees are identical in producing revenue.
The best mental model we can use here is the Pareto Principle (aka the 80/20 Rule) that states that roughly 80% of the effects come from 20% of the causes. e.g.:
- 20% of your customers represent roughly 80% of your business
- 20% of your time produces roughly 80% of your results
…and so on
We’re going to take the 80/20 rule hiring to an exponential level.
If you were to shoot for the same revenue per employee ($475,894) that the S&P 500 companies average, and let’s assume you have just 100 employees, then those 100 employees would generate $47,589,400 in revenue ($475,894 rev. per employee * 100) over the next 12 months.
Round 1 of the 80/20 of Hiring
If you applied the 80/20 rule to these 100 employees then:
- 20 employees (20%) would generate a total of $38,071,520 (80% of the $47,559,400)
- 80 employees (80%) would generate $9,517,880 (20% of the $47,589,400)
The 80/20 Rule is Exponential
But this isn’t your normal 80/20 rule — there’s been a recent upgrade to 80/20 logic.
The recent book 80/20 Sales & Marketing points out that the 20 80/rule is exponential.
What that means is that the top 20% of the top 20% of your employees (or the top 4% overall) represent 64% of your sales (calculated as 80% times 80%).
Round 2 of 80/20
So now you take 20% of the 20% of those 100 hires:
- 20% of those top 20 employees (.2 * 20 = 4 employees) are going to generate 80% of the $38,071,520 mentioned above which translates to $30,457,216.
So, 4 of your best employees will generate a total of $30M per year for you!
If we assumed each of those 4 top employees were identical to each other, then those 4 employees would average a cool $7.5 million in revenue per year for you.
But we’re not finished.
Round 3 of 80/20
Remember, 80/20 is exponential so you can keep going.
You can also do the 80/20 on those 4 top employees.
- 20% of those top 4 employees (.2 * 4 = .8 of an employee) would generate 80% of the $30,457,216, or $24,365,773.
Since that’s only .8 of an employee you then need to divide the $24.3 million by .8 to get $30,457,216.
So, drumroll…
Your Top Superstar is Worth $30.5 Million…Sometimes More
Your very top most productive hire out of the original 100 hires — a superstar or rainmaker if you will — would generate $30.5 million.
Thirty…million…dollars.
The 100 hires breaks down to revenue per employee (in descending order) of these groups:
- The top one hire = $30.5 million
- The next most productive 3 hires = $1.9 million each
- 16 of your next most productive hires = $475.9K (the average)
- 80 of your hires = $118K
All of this makes just 3 assumptions:
- You want to be typical to the S&P 500
- You believe in the Exponential version of the 80/20 Rule
- You are hiring 100 people
And, remember, $30.5 million is just the average. The numbers vary by industry.
Superstar Revenue Per Employee by Industry
I’ve included superstar revenue per employee per year by industry using the same assumptions ( thanks to CSI for the baseline revenue per employee by industry):
- Energy Superstar = $105 million
- Utilities Superstar = $77 million
- Healthcare Supertar = $61 million
- Financial Superstar = $38 million
- Consumer Discretionary Superstar = $36 million
- Basic Materials Superstar = $34 million
- Technology Superstar = $32 million
- Consumer Non-Cyclical Superstar = $27 million
- Capital Goods Superstar = $25 million
- Conglomerates Superstar = $25 million
- Retail Superstar = $19 million
- Transportation Superstar = $14 million
- Services Superstar = $12 million
And if you want to see a list of the top S&P 500 companies ranked by revenue per employee, here it is.
Do you have examples of superstar business folks worth tens of millions of dollars per year to an enterprise?
About the Author — Rob is the Co-founder & CEO of Ongig, the first-ever Employer Branding SaaS that allows employers to attract the best talent in the world faster. Yelp, Autodesk, GoDaddy, Auction.com and BMC Software are among the early customers of the Ongig SaaS.
